Module 1 Week 1 Pre-lab
All Google Form Questions on this page are due before the start of you lab period
For all experiments in this course, you will keep a data sheet (Google Sheet) and a lab notebook (Google Doc) that are individually assigned to you through Google Classroom. Before you can access your assigned documents, you must first go to Google Classroom through a Chrome browser logged into your g.hmc.edu account and join the class with this link. After you’ve done this once, you will not have to log into Google classroom separately again; all links to documents we provide through Google classroom in this lab manual should work. Once you’ve signed up for Google classroom you will also receive links to your assigned spreadsheet and lab notebook for each Module via e-mail, or you can access them through Google classroom under classwork.
Please make sure to join Google classroom from your g.hmc.edu account. Students from other Claremont colleges taking the course should consult HMC’s CIS support if you have any issues - they will issue you a g.hmc.edu account. The course will not appear in your Google Classroom account until you join the course with the link.
Throughout an experiment – but especially in the exploratory phase, when unsure what factors influence your measurement – it can be especially important to take detailed notes. Organizing a digital lab notebook and data spreadsheet can be tricky, so for Week 1 we are providing a template Google Sheet and Google Doc you should use, assigned from Google Classroom.
Make sure you have your data spreadsheet and your Module 1 Lab Notebook handy as you go through the content on this page. Please note that we require you to use the provided spreadsheet/lab notebook. The shared spreadsheet will make it easier for us to troubleshoot if any issues come up, and provides a historical record of your data collection. It is acceptable for lab partners to use one spreadsheet for collecting data. However, the partner whose spreadsheet was not used for data collection must 1) make a note in their spreadsheet stating that the data was originally collected in your lab partner’s notebook and 2) ensure you have a copy of the complete data set pasted into your own Google classroom assigned spreadsheet before the end of each lab session. Discussion and collaboration is encouraged, but both partners are individually responsible for completing their own analysis and submitting their own work.
Preface
Before diving into data collection and analysis we would like to set some expectations. This course centers around the collection, analysis, and communication of experimental data and results. We expect all of these to be conducted with care and integrity.
To make sure we all start on the same page please answer the following mini-questions. (Mini-questions will appear throughout this manual and are required to be completed before you arrive in lab each week. Please see the syllabus for more information regarding mini-questions) The first mini-question this week is based in part on information you can find in the course syllabus.
Mini-question: Acceptable forms of collaboration
Click here to open in a new tab
Data Collection: Please make sure you read the tips for electronic lab notebooks in the syllabus. We emphasize that your notebook is a record of the experiment. Deleting experimental data from a lab notebook is never acceptable. However, it is acceptable to remeasure/reanalyze data because of inaccurate or incorrect initial efforts. This includes retaking data with an improved experimental procedure. The guide to uncertainties and error analysis also contains a section on how and when it is acceptable to exclude data from analysis.
An example of an acceptable note keeping and data collection would be: You are trying to time how fast your little brother can run. Initially you do this in your hallway but you realize you are getting unreliable results. You take him to a track and restart the experiment in a way that is less sensitive to the initial conditions. You make a note next to the data you collected with a procedure you believe to be less reliable and then focus on the newly collected data in your analysis, but you do not delete the original data from your lab notebook.
Mini-question: Handling data
Click here to open in a new tab
You may find yourself in a situation where it isn’t as clear what is acceptable. When in doubt please ask.
Background
In this module, you will be working with a rather cool little piece of equipment: the acoustic levitator! This device uses the power of sound waves to levitate small objects, and has applications in various kinds of research and technology development. In this module, we will be levitating small styrofoam beads and using them to measure the speed of sound. A quick review of wave phenomena and vocabulary will be useful before you get started in the lab.
Waves are rather ubiquitous in everyday life, whether they are ocean waves crashing on a beach or fans doing “the wave” around a sports stadium. As you learned in Physics 24, a wave is a disturbance that travels through a medium. In a wave traveling in the \(+x\) direction at speed \(V\), the disturbance \(y\) away from equilibrium obeys \(y(x,t) = f(x-Vt)\), for an arbitrary function \(f\). We often study sinusoidal waves, in which \(y=A\sin{(kx-\omega t)} = A\sin{[2\pi(\frac{x}{\lambda}-\nu t)]}\). Here \(A\) is the amplitude of the wave, \(\nu\) is the frequency, \(\omega = 2\pi\nu\) is the angular frequency, and \(\lambda\) is the wavelength. Try not to confuse \(\nu\) (the Greek letter “nu”) with \(V\)!
Comparing the expressions for a general wave and a sinusoidal wave above, you can derive the relationship \(V = \lambda\nu\) for the speed of a wave in terms of is wavelength and frequency. (Try this derivation yourself and document it in your lab notebook.) This equation will be central to your data analysis in this module, since you will excite a standing wave of sound at a known frequency, measure the wavelength, and infer the speed of sound.
Mini-question: Sinusoidal Wave Quantities
Click here to open in a new tab
The easiest waves to visualize are transverse waves, in which the disturbance of the medium is perpendicular to the direction in which the wave travels. Fans at a stadium make a transverse wave, since they individually move up and down while the wave itself – the pattern of disturbance – travels sideways around the arena. Sound waves, however, are longitudinal waves: the individual air molecules oscillate parallel to the direction in which the wave is propagating. To better understand the distinction, take a look at the following animations:
![]()
The animations above show transverse (left) and longitudinal (right) travelling waves. Sound waves are longitudinal and look like the right-hand picture. To convince yourself that the individual particles are actually oscillating, follow the motion of one of the red dots on the right. Animation credit D. Russell.
If you like, you can play with another type of longitudinal wave in the Physics 50 lab; get a tall person to excite a longitudinal wave in one of the slinkies hanging from the ceiling.
If waves of the same amplitude and frequency travel through a medium in opposite directions, they sum to form a disturbance pattern that does not appear to move, but only to oscillate in time. This is called a standing wave. The mathematical details can be summed up as follows: \(y_1(x,t) = A\sin{(kx-\omega t)}\) travels in the \(+x\) direction, \(y_2(x,t) = A\sin{(kx+\omega t)}\) travels in the \(-x\) direction, and their sum is \(y_{tot} = y_1 + y_2 = 2A\sin{(kx)}\cos{(\omega t)}\) via the magic of trig identities. The same phenomenon is illustrated by the figure below:
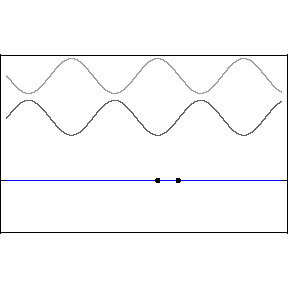
Above is a standing wave formed by counter-propagating sine waves. The blue standing wave is the sum of the upper two traveling waves. Animation credit D. Russell.
While the animation above is a great illustration of how traveling waves sum to make a standing wave, the transverse waves shown don’t give a great visual impression of a standing wave of sound. The figure below gives a clearer sense of how individual air molecules move in a standing wave of sound:
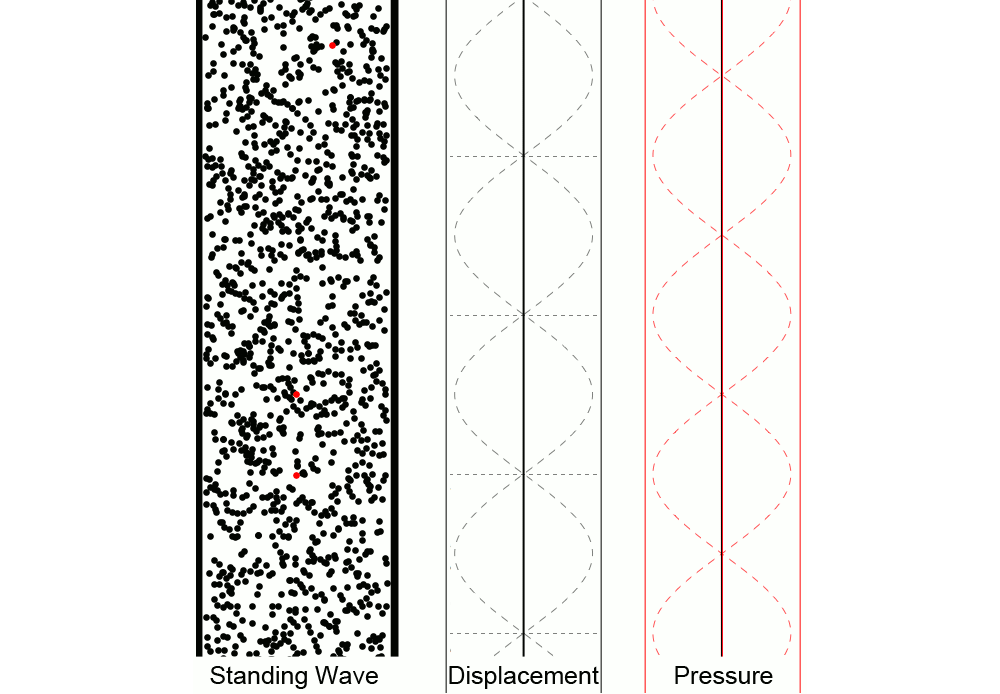
The animation above shows a standing wave of sound in air. In the left animation we see the air particles oscillating up and down, creating regions of high and low pressure. The middle animation represents the displacement from equilibrium of individual particles as a function of position (and how it changes over time). The right animation represents the deviation from equilibrium pressure as a function of position; the midpoint about which the pressure oscillates is the equilibrium pressure, not zero pressure. Notice the motion of the red particles for various locations and how the displacement and pressure animations relate to that motion.
A standing wave has locations where the displacement from equilibrium is zero at all times. These are called nodes. Locations where the displacement from equilibrium varies most over time are called antinodes. In the animation above, the bottom red dot is located at a displacement node, which is a pressure antinode. The top red dot oscillates around a displacement antinode, which is a pressure node.
You have probably studied resonant standing waves, in which the component traveling waves are caused by a single incoming wave reflecting off boundaries at ends of a string or pipe. In that case the geometry of the violin string or organ pipe dictates that only certain wavelengths (and therefore frequencies) will produce significant sound. By contrast, our acoustic levitator employs non-resonant standing waves; the two traveling waves come from two sets of speakers pointed in opposite directions and continually pushing air back and forth to produce sound. The allowed frequencies are limited only by the electromechanical response of the speakers to the signal we use to drive them.
Finally, how do our standing waves of sound trap and levitate solid particles? Certainly air can push or pull solid objects – just think of dust in a vacuuum cleaner or a beach umbrella in the wind. The forces in the acoustic levitator are more complicated, since the pressure and air movement in any given spot is oscillating back and forth many times a second. You might imagine that solid objects would simply be tugged back and forth in time with the wave instead of being stably trapped. However, because the standing waves oscillate much too fast for macro-sized objects to follow the cycles of push and pull, the objects instead end up experiencing an effective force propotional to the time average of the square of the pressure. You can read up on the theory of this acoustic radiation pressure if you like (see Gorkov, 1961 and Marzo et al., 2017), but you do not need to understand the details for this lab. You should simply know that beads end up trapped stably at pressure nodes of the standing wave.
References
-
Gorkov, L. P., “Forces acting on a small particle in an acoustic field within an ideal fluid,” Dokl. Akad. Nauk SSSR 140(1), 88 (1961).
-
A. Marzo, A. Barnes, and B. W. Drinkwater, “Tinylev: A multi-emitter single-axis acoustic levitator,” Rev. Sci. Instrum. 88(8), 085105 (2017).